Teva Reports Fourth Quarter and Full Year 2020 Financial Results

TEL AVIV, Israel--(BUSINESS WIRE)--Teva Pharmaceutical Industries Ltd. (NYSE and TASE: TEVA) today reported results for the year and the quarter ended December 31, 2020.
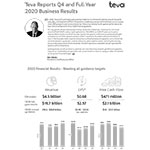
Q4 2020 and FY 2020 highlights: |
||||
|
Q4 2020 |
FY 2020 |
||
Revenues |
|
$4.5 billion |
$16.7 billion |
|
Cash flow from operating activities |
|
$331 million |
$1,216 million |
|
Free cash flow |
|
$471 million |
$2,110 million |
|
GAAP earnings (loss) per share |
|
$0.14 |
$(3.64) |
|
Non-GAAP EPS |
|
$0.68 |
$2.57 |
|
-
2021 business outlook:
- Revenues are expected to be $16.4 - $16.8 billion (2020 actual results include ~$240 million in revenues from generic products in Japan divested on February 1, 2021, along with a manufacturing site)
- Non-GAAP EPS is expected to be $2.50 - $2.70
- Free cash flow is expected to be $2.0 - $2.3 billion
"In 2020, Teva continued to provide essential medicines to millions of patients around the world every day, and despite the COVID-19 pandemic challenges, we saw minimal impact on our supply chain, R&D programs and product launches. Following a strong fourth quarter performance, we have met all components of our 2020 financial guidance," said Mr. Kåre Schultz, Teva’s President and CEO.
"Our key growth drivers delivered promising results and milestones, including the continued growth of AUSTEDO® and our leading biosimilar TRUXIMA®, as AJOVY® sales continued to improve following the launch of the auto-injector. Our generic performance was boosted by the successful launch of the generic versions of HIV-1 treatments Truvada® and Atripla® tablets in the U.S. We have also taken steps to strengthen our biopharmaceutical pipeline, with a biosimilar commercialization agreement, and are advancing other pipeline assets, including the recently announced positive results from the phase 3 trial of risperidone extended-release injectable for patients with schizophrenia."
Mr. Schultz continued, “Looking ahead, we will continue to optimize our manufacturing network, portfolio and pipeline, improve our profitability and generate cash, as we remain on track to repay our debt and achieve our long-term financial targets."
2020 Annual Consolidated Results
Revenues in 2020 were $16,659 million, a decrease of 1% in both U.S. dollar and local currency terms, compared to 2019, mainly due to a decline in revenues from certain oncology products, COPAXONE® and certain respiratory products, partially offset by higher revenues from AUSTEDO and AJOVY. The decline in revenues was also affected by reduced demand for certain products resulting from the impact of the COVID-19 pandemic.
Exchange rate movements during 2020 including hedging effects, in comparison with 2019, negatively impacted our revenues by $33 million, our GAAP operating loss by $56 million and our non-GAAP operating income by $49 million.
GAAP gross profit was $7,726 million in 2020, an increase of 3% compared to 2019. GAAP gross profit margin was 46.4% in 2020, compared to 44.6% in 2019. Non-GAAP gross profit was $8,734 million in 2020, slightly higher than 2019, and Non-GAAP gross profit margin was 52.4% in 2020, compared to 51.5% in 2019. The increase in gross profit as a percentage of revenues was mainly due to higher profitability in North America, resulting from higher revenues from AUSTEDO and AJOVY, higher gross profit margin in our U.S. generics business, partially offset by a decline in COPAXONE revenues due to generic competition.
GAAP Research and Development (R&D) expenses in 2020 were $997 million, a decrease of 1% compared to 2019. Non-GAAP R&D expenses in 2020 were $941 million, or 5.6% of revenues, compared to $1,004 million, or 5.9% of revenues, in 2019. Our lower R&D expenses in 2020, compared to 2019, resulted primarily from project milestone timing and pipeline optimization.
GAAP Selling and Marketing (S&M) expenses in 2020 were $2,498 million, a decrease of 4% compared to 2019. Non-GAAP S&M expenses were $2,322 million, or 13.9% of revenues, in 2020, compared to $2,438 million, or 14.4% of revenues, in 2019. This decrease was mainly due to lower marketing and travel costs attributed to restrictions related to the COVID-19 pandemic.
GAAP General and Administrative (G&A) expenses in 2020 were $1,173 million, a decrease of 2% compared to 2019. Non-GAAP G&A expenses were $1,115 million in 2020, or 6.7% of revenues, compared to $1,145 million, or 6.8% of revenues, in 2019.
We recorded a goodwill impairment charge of $4,628 million related to our North America reporting unit in 2020, in connection with current market capitalization influenced by uncertainty regarding the timeframe for resolution of certain litigations.
GAAP other income in 2020 was $40 million, compared to $76 million in 2019. Non-GAAP other income in 2020 was $31 million, compared to $27 million in 2019.
GAAP operating loss was $3,572 million in 2020, compared to operating loss of $443 million in 2019. The increase was mainly due to a goodwill impairment charge recorded in 2020. Non-GAAP operating income was $4,388 million, an increase of 6% compared to $4,142 million in 2019.
Adjusted EBITDA (non-GAAP operating income, which excludes amortization and certain other items, and excluding depreciation expenses) in 2020 was $4,912 million, compared to $4,685 million in 2019.
In 2020, GAAP financial expenses were $834 million, compared to $822 million in 2019. Non-GAAP financial expenses were $918 million in 2020, compared to $824 million in 2019.
In 2020, we recognized a GAAP tax benefit of $168 million, or 4%, on a pre-tax loss of $4,406 million. In 2019, we recognized a tax benefit of $278 million, or 22%, on a pre-tax loss of $1,265 million. Our tax rate for 2020 was lower than in 2019, mainly due to goodwill impairments that did not have a corresponding tax effect.
Non-GAAP income taxes for 2020 were $577 million on non-GAAP pre-tax income of $3,470 million. Non-GAAP income taxes in 2019 were $597 million on non-GAAP pre-tax income of $3,317 million. The non-GAAP tax rate for 2020 was 17%, compared to 18% in 2019.
GAAP net loss attributable to Teva’s ordinary shareholders and GAAP diluted loss per share in 2020 were $3,990 million and $3.64, respectively, compared to net loss of $999 million and diluted loss per share of $0.91 in 2019. Non-GAAP net income attributable to ordinary shareholders for calculating diluted EPS and non-GAAP diluted EPS in 2020 were $2,830 million and $2.57, respectively, compared to $2,627 million and $2.40 in 2019.
The weighted average diluted shares outstanding used for the fully diluted share calculation on a GAAP basis for 2020 and 2019 were 1,095 million and 1,091 million shares, respectively. The weighted average outstanding shares used for the fully diluted EPS calculation on a non-GAAP basis for 2020 and 2019 were 1,099 million and 1,094 million shares, respectively.
As of December 31, 2020 and 2019, the fully diluted share count for purposes of calculating our market capitalization was approximately 1,117 million and 1,108 million shares, respectively.
Non-GAAP information: Net non-GAAP adjustments in 2020 were $6,820 million. Non-GAAP net income and non-GAAP EPS for the year were adjusted to exclude the following items:
- A goodwill impairment charge of $4,628 million related to our North America reporting unit in the third quarter of 2020;
- $1,918 million impairment of long-lived assets comprised mainly of impairments of identifiable intangible assets totaling $1,502 million ($797 million of IPR&D assets and $705 million of identifiable product rights);
- Amortization of purchased intangible assets totaling $1,020 million, of which $894 million is included in cost of goods sold and the remaining $126 million in selling and marketing expenses;
- Legal settlements and loss contingencies of $60 million;
- Restructuring expenses of $120 million;
- Purchase of in process R&D of $37 million;
- Contingent consideration income of $81 million, mainly related to a decrease in future royalties
- Gain from equity investment of $134 million, reflecting the difference between the book value of our investment in American Well Corporation and its fair value as of the date it completed its initial public offering in September 2020;
- Finance income of $85 million, mainly related to the American Well equity holding;
- Equity compensation expenses of $129 million;
- Other non-GAAP items of $130 million;
- Minority interest adjustment of $177; and
- Related tax effect of $745 million.
Teva believes that excluding such items facilitates investors’ understanding of its business. For further information, see below the U.S. GAAP to adjusted non-GAAP reconciliation tables under “Financial Tables” and the information under “Non-GAAP Financial Measures.” Investors should consider non-GAAP financial measures in addition to, and not as replacement for, or superior to, measures of financial performance prepared in accordance with GAAP.
Cash flow generated from operating activities in 2020 was $1,216 million, an increase of $468 million, or 63%, compared to 2019. The increase was mainly due to higher profit in our North America segment during 2020.
Free cash flow (Cash flow generated from operating activities in 2020, net of cash used for capital investments and beneficial interest collected in exchange for securitized trade receivables) was $2,110 million in 2020, compared to $2,053 million in 2019. The increase in 2020 resulted mainly from higher cash flow generated from operating activities, partially offset by less cash generated from sales of assets and higher capital investments.
As of December 31, 2020, our debt was $25,919 million, compared to $26,908 million as of December 31, 2019. This decrease was mainly due to senior notes repaid at maturity with cash generated during the year, partially offset by exchange rate fluctuations. The portion of total debt classified as short-term as of December 31, 2020 was 12%, compared to 9% as of December 31, 2019, due to a reclassification of upcoming maturities in 2021. Our average debt maturity was approximately 5.8 years as of December 31, 2020, compared to 6.4 years as of December 31, 2019.
Fourth Quarter 2020 Consolidated Results
Revenues in the fourth quarter of 2020 were $4,454 million, flat compared to the fourth quarter of 2019. In local currency terms, revenues decreased by 1%, mainly due to lower revenues from Anda, our distribution business in the United States, COPAXONE and certain oncology products, offset by higher revenues from our U.S. generics business, AUSTEDO, most markets in our International Markets segment and AJOVY. Revenues in our North America and Europe segments were impacted by some reductions in volume due to less physician and hospital activity during the COVID-19 pandemic, but our North America segment also experienced increases in demand for certain products related to the treatment of COVID-19 and its symptoms.
Exchange rate differences between the fourth quarter of 2020 and the fourth quarter of 2019, including hedging effects positively impacted our revenues by $35 million and negatively impacted our GAAP operating income by $30 million. Our non-GAAP operating income was negatively impacted by $24 million.
GAAP gross profit was $2,048 million in the fourth quarter of 2020, an increase of 5% compared to the fourth quarter of 2019. GAAP gross profit margin was 46.0% in the fourth quarter of 2020, compared to 43.8% in the fourth quarter of 2019. Non-GAAP gross profit was $2,327 million in the fourth quarter of 2020, an increase of 3% compared to the fourth quarter of 2019. Non-GAAP gross profit margin was 52.3% in the fourth quarter of 2020, compared to 50.6% in the fourth quarter of 2019. The increase in non-GAAP gross profit margin in the fourth quarter of 2020 resulted from higher revenues from AUSTEDO and AJOVY, higher gross margin in our U.S. generics business, partially offset by a decline in COPAXONE revenues due to generic competition.
GAAP Research and Development (R&D) expenses in the fourth quarter of 2020 were $293 million, an increase of 26% compared to the fourth quarter of 2019. Non-GAAP R&D expenses were $254 million, or 5.7% of quarterly revenues, in the fourth quarter of 2020, compared to $237 million, or 5.3% of quarterly revenues, in the fourth quarter of 2019. The increase in R&D expenses in the fourth quarter of 2020 resulted primarily from initiation and advanced development activities for certain specialty and biosimilar products.
GAAP Selling and Marketing (S&M) expenses in the fourth quarter of 2020 were $683 million, a decrease of 3% compared to the fourth quarter of 2019. Non-GAAP S&M expenses were $627 million, or 14.1% of quarterly revenues in the fourth quarter of 2020, compared to $665 million, or 14.9% of quarterly revenues in the fourth quarter of 2019.
GAAP General and Administrative (G&A) expenses in the fourth quarter of 2020 were $327 million, an increase of 3% compared to the fourth quarter of 2019. Non-GAAP G&A expenses were $312 million in the fourth quarter of 2020, or 7.0% of quarterly revenues in the fourth quarter of 2020, compared to $309 million, or 6.9% of quarterly revenues in the fourth quarter of 2019.
GAAP other income in the fourth quarter of 2020 was $10 million, compared to $47 million in the fourth quarter of 2019. Non-GAAP other income in the fourth quarter of 2020 was $5 million, compared to $9 million in fourth quarter of 2019.
GAAP operating income in the fourth quarter of 2020 was $406 million, compared to an income of $148 million in the fourth quarter of 2019. Non-GAAP operating income in the fourth quarter of 2020 was $1,140 million, an increase of 7% compared to the fourth quarter of 2019.
EBITDA (non-GAAP operating income, which excludes amortization and certain other items, as well as depreciation expenses) was $1,277 million in the fourth quarter of 2020, an increase of 6% compared to $1,204 million in the fourth quarter of 2019.
GAAP financial expenses for the fourth quarter of 2020 were $268, compared to $186 million in the fourth quarter of 2019. Non-GAAP financial expenses were $235 million in the fourth quarter of 2020, compared to $198 million in the fourth quarter of 2019.
In the fourth quarter of 2020, we recognized a GAAP tax benefit of $22 million on a pre-tax GAAP income of $138 million. In the fourth quarter of 2019, we recognized a GAAP tax benefit of $119 million on a pre-tax GAAP loss of $38 million. Non-GAAP income taxes for the fourth quarter of 2020 were $141 million, or 16%, on pre-tax non-GAAP income of $905 million. Non-GAAP income taxes in the fourth quarter of 2019 were $155 million, or 18%, on pre-tax non-GAAP income of $863 million.
GAAP net income attributable to Teva and GAAP diluted earnings per share in the fourth quarter of 2020 were $150 million and $0.14, respectively, compared to GAAP net income attributable to Teva and GAAP diluted earnings per share of $110 million and $0.10, respectively, in the fourth quarter of 2019. Non-GAAP net income attributable to Teva and non-GAAP diluted earnings per share in the fourth quarter of 2020 were $753 million and $0.68, respectively, compared to $683 million and $0.62, respectively, in the fourth quarter of 2019.
For the fourth quarter of 2020, the weighted average outstanding shares for the fully diluted EPS calculation on a GAAP basis was 1,100 million shares, compared to 1,094 million shares in the fourth quarter of 2019. The weighted average outstanding shares for the fully diluted EPS calculation on a non-GAAP basis was 1,100 million shares in the fourth quarter of 2020, compared to 1,094 million shares in the fourth quarter of 2019.
Non-GAAP information: Net non-GAAP adjustments in the fourth quarter of 2020 were $603 million. Non-GAAP net income and non-GAAP EPS for the fourth quarter were adjusted to exclude the following items:
- $233 million impairment of long-lived assets, comprised mainly of impairments of identifiable intangible assets totaling $224 million ($135 million of identifiable product rights globally, of which $127 million are from the U.S., and $89 million of in process R&D assets);
- Amortization of purchased intangible assets of $262 million, of which $231 million is included in cost of sales and the remaining $31 million in S&M expenses;
- Legal settlements and loss contingencies of $50 million;
- Restructuring expenses of $38 million;
- Purchase of in process R&D of $34 million;
- Contingent consideration of $15 million, mainly related to bendamustine;
- Finance expenses of $33 million, mainly related to the American Well equity holding;
- Equity compensation expenses of $40 million;
- Other non-GAAP items of $60 million; and
- Related tax effect of $162 million.
Teva believes that excluding such items facilitates investors' understanding of its business. For further information, see below the U.S. GAAP to adjusted non-GAAP reconciliation tables under “Financial Tables” and the information under “Non-GAAP Financial Measures.” Investors should consider non-GAAP financial measures in addition to, and not as replacement for, or superior to, measures of financial performance prepared in accordance with GAAP.
Cash flow generated from operating activities during the fourth quarter of 2020 was $331 million, compared to $538 million in the fourth quarter of 2019. The decrease was mainly due to higher payments to suppliers in the fourth quarter of 2020.
Free cash flow (Cash flow generated from operating activities, net of cash used for capital investments and beneficial interest collected in exchange for securitized accounts receivables) was $471 million in the fourth quarter of 2020, compared to $974 million in the fourth quarter of 2019. The decrease in 2020 resulted mainly from lower cash flow generated from operating activities, less cash generated from sales of assets and higher capital investments.
Segment Results for the Fourth Quarter of 2020
North America Segment
Our North America segment includes the United States and Canada.
The following table presents revenues, expenses and profit for our North America segment for the three months ended December 31, 2020 and 2019:
|
Three months ended December 31, |
|||||||||||||
|
|
2020 |
|
2019 |
||||||||||
|
(U.S. $ in millions / % of Segment Revenues) |
|||||||||||||
Revenues |
$ |
2,300 |
|
100 |
% |
$ |
2,373 |
|
100.0 |
% |
||||
Gross profit |
|
1,281 |
|
55.7 |
% |
|
1,196 |
|
50.4 |
% |
||||
R&D expenses |
|
167 |
|
7.2 |
% |
|
155 |
|
6.5 |
% |
||||
S&M expenses |
|
258 |
|
11.2 |
% |
|
265 |
|
11.2 |
% |
||||
G&A expenses |
|
119 |
|
5.2 |
% |
|
97 |
|
4.1 |
% |
||||
Other (income) expense |
|
(1 |
) |
§ |
|
(7 |
) |
§ |
||||||
Segment profit* |
$ |
738 |
|
32.1 |
% |
$ |
686 |
|
28.9 |
% |
||||
_________ |
||||||||||||||
* Segment profit does not include amortization and certain other items.
|
||||||||||||||
Revenues from our North America segment in the fourth quarter of 2020 were $2,300 million, a decrease of $73 million, or 3%, compared to the fourth quarter of 2019, mainly due to lower revenues from Anda, our distribution business in the United States, COPAXONE and BENDEKA®/TREANDA®, partially offset by higher revenues from our U.S. generics business, AUSTEDO and AJOVY.
Our North America segment has experienced some reductions in volume due to less physician and hospital activity during the COVID-19 pandemic, but has also experienced increase in demand for certain products related to the treatment of COVID-19 and its symptoms. In addition, the ability to promote our new specialty products, primarily AJOVY and AUSTEDO, has been impacted by less physician visits by patients and less physician interactions by our sales personnel.
Revenues in the United States, our largest market, were $2,170 million in the fourth quarter of 2020, a decrease of $48 million, or 2%, compared to the fourth quarter of 2019.
Revenues by Major Products and Activities
The following table presents revenues for our North America segment by major products and activities for the three months ended December 31, 2020 and 2019:
|
|
Three months ended
|
|
Percentage
|
|||||
|
2020 |
|
2019 |
|
2019-2020 |
||||
|
|
(U.S. $ in millions) |
|
|
|||||
|
|
|
|
|
|
|
|||
Generic products |
|
$ |
1,206 |
|
$ |
1,137 |
|
6 |
% |
AJOVY |
|
|
36 |
|
|
25 |
|
42 |
% |
AUSTEDO |
|
|
185 |
|
|
136 |
|
36 |
% |
BENDEKA/TREANDA |
|
|
102 |
|
|
125 |
|
(19 |
%) |
COPAXONE |
|
|
213 |
|
|
264 |
|
(19 |
%) |
ProAir®* |
|
|
67 |
|
|
80 |
|
(17 |
%) |
QVAR® |
|
|
40 |
|
|
67 |
|
(40 |
%) |
Anda |
|
|
321 |
|
|
412 |
|
(22 |
%) |
Other |
|
|
131 |
|
|
128 |
|
2 |
% |
Total |
|
$ |
2,300 |
|
$ |
2,373 |
|
(3 |
%) |
_________ |
|
|
|
|
|
|
|||
* Does not include revenues from the ProAir authorized generic, which are included under generic products |
|||||||||
Generic products revenues in our North America segment in the fourth quarter of 2020 increased by 6% to $1,206 million, compared to the fourth quarter of 2019, mainly due to new generic product launches, higher revenues from TRUXIMA (the biosimilar to Rituxan®) and our ProAir authorized generic, partially offset by lower revenues from other generic products.
On September 30, 2020, we launched emtricitabine and tenofovir disoproxil fumarate tablets (the generic equivalent of Truvada®) and efavirenz, emtricitabine and tenofovir disoproxil fumarate tablets (the generic equivalent for Atripla®) in the United States.
In the fourth quarter of 2020, we led the U.S. generics market in total prescriptions and new prescriptions, with approximately 348 million total prescriptions (based on trailing twelve months), representing 9.6% of total U.S. generic prescriptions according to IQVIA data.
AJOVY revenues in our North America segment in the fourth quarter of 2020 were $36 million compared to $25 million in the fourth quarter of 2019. This increase was mainly due to growth in volume. AJOVY’s exit market share in the United Stated in terms of total number of prescriptions during 2020 was 20% compared to 17% in 2019.
AUSTEDO revenues in our North America segment in the fourth quarter of 2020 were $185 million, compared to $136 million in the fourth quarter of 2019. This increase was mainly due to growth in volume.
BENDEKA and TREANDA combined revenues in our North America segment in the fourth quarter of 2020 decreased by 19% to $102 million, compared to the fourth quarter of 2019, mainly due to the emergence of alternative novel therapies and continued competition from Belrapzo® (a ready-to-dilute bendamustine hydrochloride product from Eagle Pharmaceuticals, Inc.).
COPAXONE revenues in our North America segment in the fourth quarter of 2020 decreased by 19% to $213 million, compared to the fourth quarter of 2019, mainly due to generic competition in the United States.
ProAir (HFA and RespiClick) revenues in our North America segment in the fourth quarter of 2020 decreased by 17% to $67 million, compared to the fourth quarter of 2019. In January 2019, we launched our own ProAir authorized generic in the United States, following the launch of a generic version of Ventolin® HFA, another albuterol inhaler. Revenues from our ProAir authorized generic are included in “generic products” above.
QVAR revenues in our North America segment in the fourth quarter of 2020 decreased to $40 million, compared to the fourth quarter of 2019. This decrease was mainly due to lower volume.
Anda revenues in our North America segment in the fourth quarter of 2020 decreased by 22% to $321 million, compared to the fourth quarter of 2019, mainly due to lower volume partially as a result of the COVID-19 pandemic.
North America Gross Profit
Gross profit from our North America segment in the fourth quarter of 2020 was $1,281 million, an increase of 7% compared to the fourth quarter of 2019. This increase was mainly due to new generic product launches and higher revenues from AUSTEDO, partially offset by lower revenues from COPAXONE.
Gross profit margin for our North America segment in the fourth quarter of 2020 increased to 55.7%, compared to 50.4% in the fourth quarter of 2019. This increase was mainly due to new generic product launches and higher revenues from AUSTEDO.
North America Profit
Profit from our North America segment in the fourth quarter of 2020 was $738 million, an increase of 8% compared to $686 million in the fourth quarter of 2019.
Contacts
IR Contacts
United States
Kevin C. Mannix, (215) 591-8912
Israel
Yael Ashman, 972 (3) 914-8262
PR Contacts
United States
Kelley Dougherty, (973) 832-2810
Israel
Yonatan Beker, 972 (54) 888 5898
Read full story here
Editor Details
-
Company:
- Businesswire
